Data collection and ingestion
Pulled in from the systems that hold it, on a schedule or as it happens. No more exporting a spreadsheet on a Friday afternoon.

BeetleOPS services · Data
Raw data turned into structured, actionable insight through automated pipelines, dashboards and reporting.
What this is
Collection, storage and analysis, tidied up until arguments get settled with figures
Automated pipelines, a warehouse that holds the record, and dashboards and reports on top. Board papers and the decision somebody takes on a Tuesday morning come from the same place, which is the whole point.
From raw data to a number you can act on.
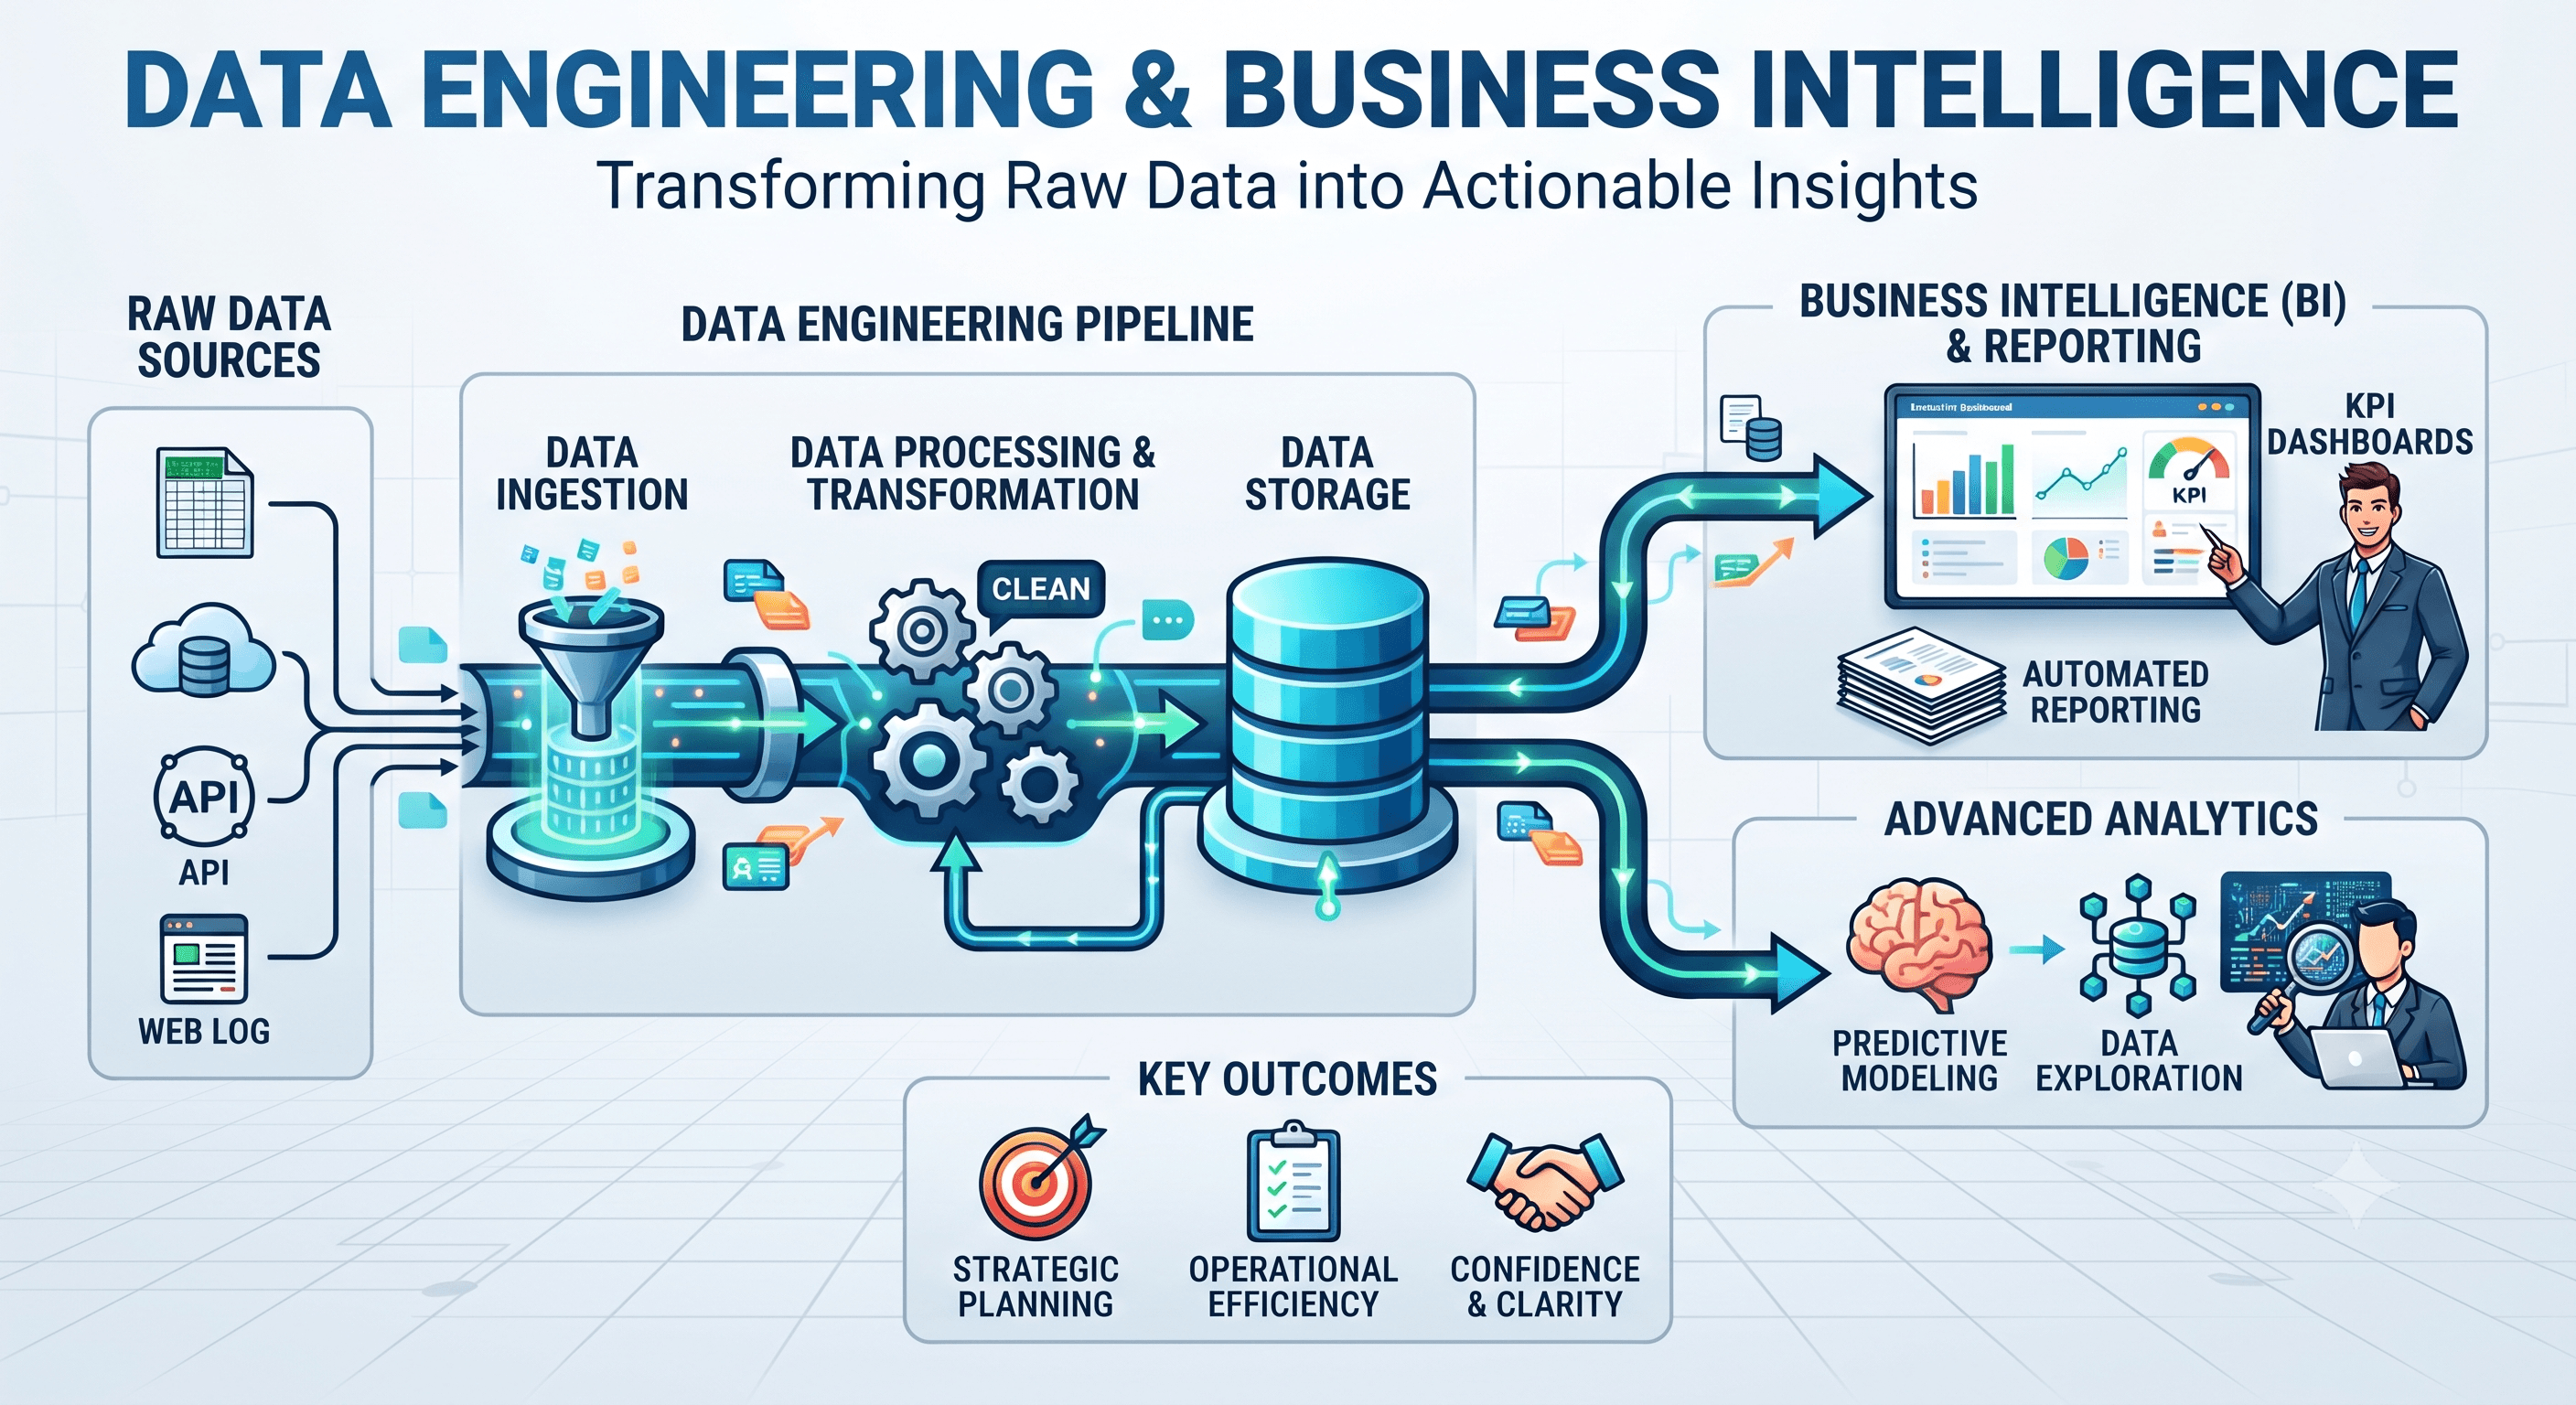
Pulled in from the systems that hold it, on a schedule or as it happens. No more exporting a spreadsheet on a Friday afternoon.
A structured store shaped around the questions you ask. Ask one and you get an answer, not a two-week assembly job.
Extraction, cleaning and transformation that run themselves. When a run fails you hear about it, instead of noticing weeks later that a number looks odd.
The measures that matter, current, and built for the person who has to act on them. Not for whoever made the chart.
Scheduled reports where somebody needs the same view every week. Self-serve where they need to ask their own questions.
Definitions written down, access controlled, lineage traceable. Two teams quoting the same metric should mean the same thing by it.
Find what data exists, where it lives, who owns it and how much of it can be trusted as it stands.
Definitions and structure agreed first. A customer, an order and a margin each need to mean one thing across the business.
Build the automated collection, cleaning and loading, with monitoring and alerting on the runs themselves.
Dashboards and reports on top of the model, built with the people who will use them. They are the ones who know what is missing.
Keep it running as sources change, and extend it as the questions the business asks get sharper.
We will trace where its numbers come from and show you what it takes to make them dependable.